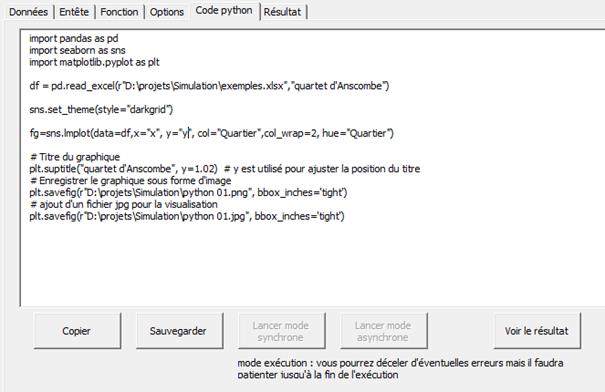
| import pandas as pd import seaborn as sns import matplotlib.pyplot as plt | Statements |
| df = pd.read_excel(r"D:\projects\Simulation\exemples.xlsx","Anscombe quartet") | Dataframe Creation Using Pandas |
| sns.set_theme(style="darkgrid") | Choosing the Theme for the Chart Background |
| fg=sns.lmplot(data=df,x="x", y="y", col="Neighborhood",col_wrap=2, hue="Neighborhood") | Creating the Chart and Associated Grid |
| # Chart title plt.suptitle("Anscombe quartet", y=1.02) # y is used to adjust the position of the title | Adding the Title Above the Grid |
| # Save the graph as an image plt.savefig(r"D:\projects\Simulation\python 01.png", bbox_inches='tight') | Creation of a file that can be inserted into excel |
# ajout d'un fichier jpg pour la visualisation
plt.savefig(r"D:\projets\Simulation\python 01.jpg", bbox_inches='tight')
Creation of a jpg file to make a preview in the userform. |

 Up
Up