Details of the possibilities | ||
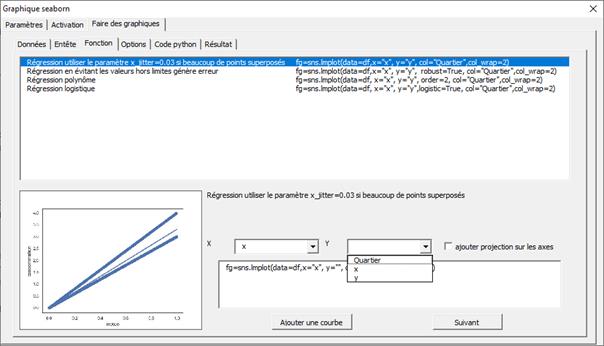
You have dozens of seaborn charts. The previous choice narrowed the possibilities. Now, you can choose a chart from the list provided. When you choose one, a tile represents the type of chart possible and the formula updates. You have two drop-down menus to choose your x and y variables.
|

 Up
Up