Options | ||
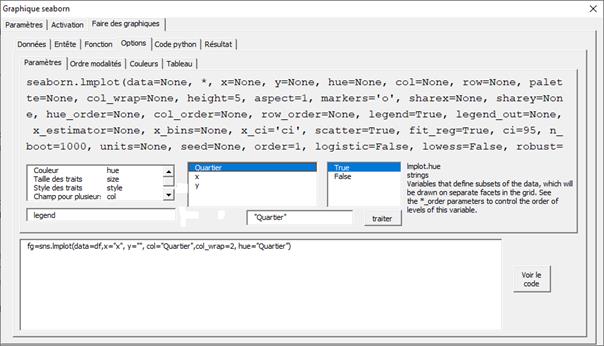
The basis of the formula is done, now you can refine the options: On the left you have a menu with the most often used parameters after, you have a menu with the fields and finally the third menu with different possibilities depending on the chosen parameter. When you hover over a parameter in the formula, its definition moves to the right. You can click to add the parameter: its name is put in the box on the left, in this case "hue". In one of the two menus here, you click on "district" in the list of fields. By pressing the process button, the code is changed with the addition of the parameter.
|

 Unseen options