Creating a statistical chart with the seaborn library
The purpose of the tool presented here is to allow you to create python code in such a way that creating a chart with the seaborn library is almost as easy as inserting an excel chart. To do this, we're going to use the seaborn library. https://seaborn.pydata.org/
Seaborn is a matplotlib-based Python data visualization library created by Michael Waskom, PhD. It provides a high-level interface for drawing attractive and informative statistical graphs.
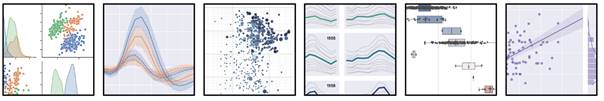


 Seaborn Code Example